
Sunday, September 20, 2026

SLB Plans $4B Shareholder Returns in 2026 as Digital Revenue Drives Q4 Margin Gains

SLB will return over $4 billion to shareholders in 2026 through dividends and buybacks after Q4 2025 EBITDA margins expanded on strong digital performance. The energy services provider increased its dividend and generated robust cash flow from working capital improvements. Four peers—Baker Hughes, Halliburton, Liberty Energy, and Suncor Energy—also beat Q4 earnings estimates.

SLB Plans $4B Shareholder Returns in 2026 as Digital Revenue Drives Q4 Margin Gains
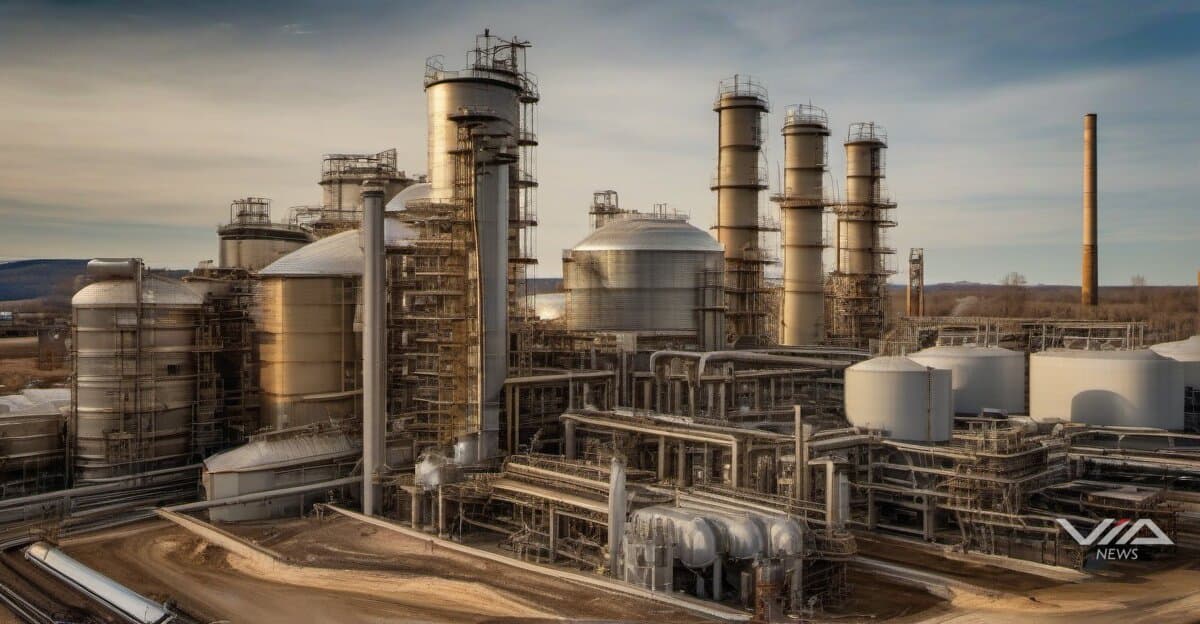
Image generated by AI for illustrative purposes. Not actual footage or photography from the reported events.
Loading stream...

SLB announced plans to return more than $4 billion to shareholders in 2026 through dividend payments and share buybacks, following margin expansion driven by digital revenue in Q4 2025. The company raised its dividend for 2026 as operating cash flow strengthened.

Q4 adjusted EBITDA margins at SLB widened primarily from digital segment performance. Strong cash flow in the quarter came from working capital unwinding, supported by improved collections and lower inventory levels. The digital business unit outperformed traditional services in margin contribution.

Baker Hughes, Halliburton, Liberty Energy, and Suncor Energy all exceeded Q4 2025 earnings expectations. The pattern suggests energy services companies benefited from operational efficiency gains and cost management in the final quarter.

Digital transformation investments appear correlated with cash generation across the sector. Companies that expanded digital capabilities reported stronger working capital management and margin performance compared to peers relying solely on traditional oilfield services.

The $4 billion shareholder return commitment from SLB represents a test case for whether Q4 earnings strength translates into sustained capital allocation programs. Energy services firms historically scale buybacks and dividends based on quarterly performance rather than annual trends.

Q1-Q2 2026 announcements from Baker Hughes, Halliburton, Liberty Energy, and Suncor will indicate whether the Q4 earnings beats lead to increased shareholder distributions. Companies with digital revenue streams may demonstrate more consistent cash flow than those dependent on upstream spending cycles.

Investors should track dividend increase announcements and buyback authorization expansions in the first half of 2026. The correlation between digital investment intensity and cash flow stability will become clearer as companies report Q1 results. SLB's 2026 capital allocation plan sets a benchmark for peers to match or exceed based on their Q4 performance.

What we know · the intelligence behind this page
Live from the substrate
What we're seeing
AI Boom Hits a Fork: Slowdown Calls Clash with Capex Confidence as Markets Get Nervous
Dario Amodei's repeated calls for a global slowdown in frontier AI development, echoed by Microsoft's new humanist AI code of conduct and FTC antitrust caution, are being publicly rejected by Nvidia and Meta leadership even as hyperscaler spending draws fresh skeptical scrutiny (Wachter's analysis, Burry-style overbuilding worries) and weak guidance from Adobe and a post-slowdown-comment selloff in GE Vernova signal investor jitters. Meanwhile wealth and security effects of the AI race keep compounding — Zhang Yiming's fortune surging on AI-driven ByteDance value, a Chinese hacking firm weaponizing AI against stolen government secrets, and low-quality AI-generated products (an AI sitcom, a spam-flooding agent platform) fueling backlash even as adoption races ahead.
Our read on the data ›
Signals we're tracking
EPKINLY Regulatory-Clinical Success Cascade
High probability of expanded label indications, additional combination approvals, and competitive positioning strength in follicular lymphoma market. Predicts positive commercial uptake and potential accelerated review for related indications.
Patterns we're watching ›
Where sources disagree
Berkshire Hathaway
Both facts report Berkshire Hathaway's cash position on 2026-01-01 with identical observation timestamps, but claim vastly different values: 380 billion USD vs 400 USD. These cannot both be true for the same entity at the same point in time. The magnitude of the discrepancy (a factor of ~10^9) rules out rounding, unit conversion, or methodological differences.
We flag conflicts openly ›
Recently verified
Checked against the original source
4,982
facts traced to their source — and we flag the ones that don't hold up.
101 entities tracked4,982 facts checked against source5,299 source documents archived
Query this data → isubstrate.com