
Wednesday, October 7, 2026

Interactive Brokers hits 1.3 basis point trading cost, sets new threshold for retail equity competition

Interactive Brokers PRO clients executed U.S. equities at 1.3 basis points all-in cost in February 2026, down from 1.9 basis points in January. The sub-3bp threshold marks a competitive barrier forcing traditional brokers toward automation or retail market exit.

Interactive Brokers hits 1.3 basis point trading cost, sets new threshold for retail equity competition
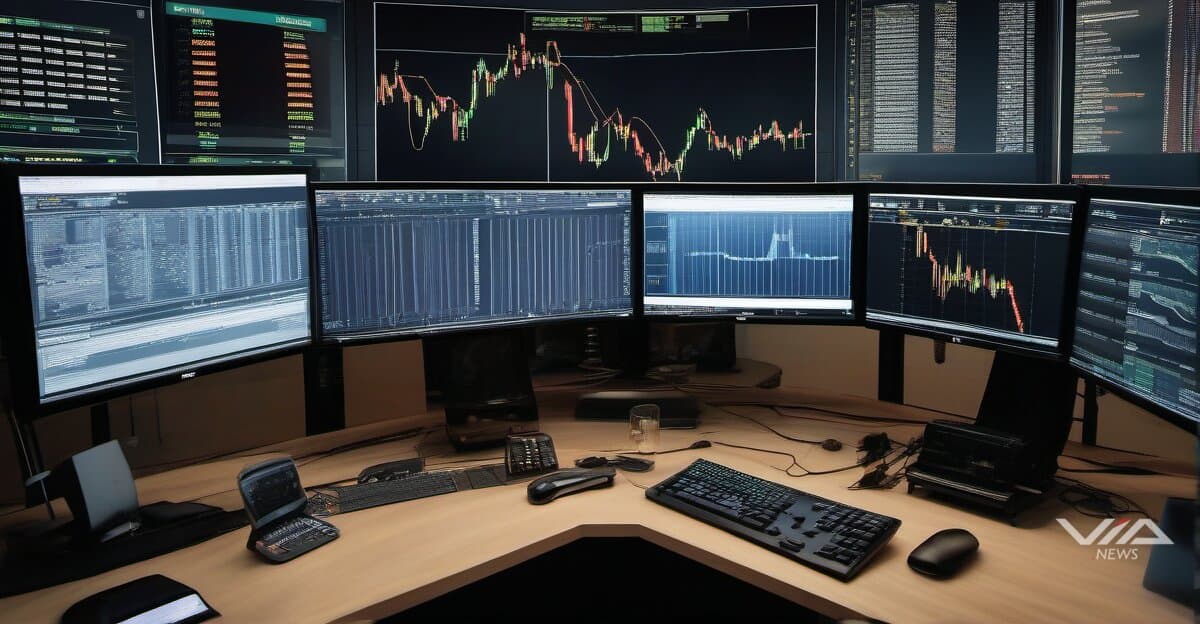
Image generated by AI for illustrative purposes. Not actual footage or photography from the reported events.
Loading stream...

Interactive Brokers PRO clients paid 1.3 basis points in total execution and clearing costs for U.S. Reg.-NMS stocks in February 2026, with average trade size of $24,009. January costs were 1.9 basis points on $21,785 average trades.

The twelve-month rolling average dropped to 2.6 basis points in January and 2.7 basis points in February. Interactive Brokers attributed the cost structure to four decades of technology and automation investment that built what it calls a "uniquely sophisticated platform."

The sub-3 basis point threshold creates pressure on traditional brokers operating with manual processes and legacy infrastructure. Exchange, clearing and regulatory fees consume 58-60% of futures commissions, indicating limited margin compression capability without automation.

Broker business models split into two paths: invest heavily in AI and machine learning-driven automation to match IBKR's cost structure, or exit retail equity trading entirely. Mid-tier pricing positions become unsustainable as cost-conscious traders migrate to automated platforms.

Market microstructure shifts as ultra-low costs enable higher-frequency rebalancing and tax-loss harvesting strategies previously uneconomical for retail accounts. A $100,000 portfolio turning over twice annually at 1.3bp pays $26 in costs versus $150 at 7.5bp, expanding the viable strategy universe.

Traditional brokers face a technology investment decision point. Building comparable automation infrastructure requires multi-year development cycles and eight-figure budgets. Acquiring automation capabilities through M&A competes with simply referring clients to established low-cost platforms for equity execution while focusing on higher-margin products.

The cost compression trajectory suggests further declines as Interactive Brokers scales its automated systems across growing client volumes. Fixed technology costs spread over larger asset bases drive incremental margin improvement, creating a self-reinforcing competitive advantage.

Regulatory fee structures remain the primary floor for cost reduction. Exchange and clearing fees fixed by regulation prevent brokers from reducing costs below infrastructure minimums regardless of automation efficiency.

Market share data over the next 12-24 months will test whether the sub-3bp threshold triggers broker exits or accelerates technology investment announcements. Early indicators include commission structure changes and platform automation disclosures from competing retail brokerages.

In this story · Knowledge Files

What we know · the intelligence behind this page
Live from the substrate
What we're seeing
Obesity and Immunology Readouts, Big Pharma M&A and AI-Designed Drugs Converge Into a Q4 2026 Catalyst Wave
Late-stage data and deal activity are clustering ahead of Q4 2026. Novo Nordisk's CagriSema won Best Abstract at EASD 2026 for its brain and body (fMRI/MRI) data, Lilly showed ADtouch results for EBGLYSS and agreed to buy Merida Biosciences for $2.9B, and Merck's tulisokibart hit its Phase 2b endpoints. A key regulatory catalyst follows: the FDA PDUFA date for the ivonescimab BLA on 2026-11-14. AI-designed rentosertib showing anti-aging effects adds a speculative AI-drug-discovery thread, while QAIAx's microcities trial and QIII pilot (planned 2027-01-01) are peripheral, forecast-only items.
Our read on the data ›
Signals we're tracking
Satellite-Terrestrial Network Integration Acceleration
Increased investment and launches in hybrid satellite-cellular networks across telecom industry; competitive responses from other carriers; regulatory activity around satellite spectrum; expansion of emergency/rural connectivity use cases
Patterns we're watching ›
Where sources disagree
ING Group
Both facts record the same metric (shares_outstanding) for ING Group at the identical observation date (2025-12-31). FACT A states 2,902,437,688 shares; FACT B states 2,902 million shares (2,902,000,000). The difference is 437,688 shares (~0.015%). This is a genuine value conflict, though the discrepancy appears to result from FACT B rounding to the nearest million while FACT A provides the precise count.
We flag conflicts openly ›
Recently verified
✓ Checked against the original source
4,985
facts traced to their source — and we flag the ones that don't hold up.
101 entities tracked4,985 facts checked against source5,351 source documents archived
Query this data → isubstrate.com